RFM Analysis and Churn Prediction for Shopify and Salla Stores
What RFM analysis is
RFM analysis groups customers by three numbers from their order history:
- Recency: how long since their last order.
- Frequency: how many orders they have placed.
- Monetary value: how much they have spent.
Score each customer on all three and you get groups that need very different messages: a recent, frequent, high-value customer is a champion; someone who bought once, a long time ago, for a small amount, is probably gone.
How to run it on your store
- Export orders. From Shopify, export orders with customer, date and total. From Salla or Zid, use the orders export or the API.
- Group by customer. For each customer, take the date of the last order, the count of orders and the sum of order totals. Exclude cancelled orders.
- Score each number 1 to 5. Split customers into five equal groups on each measure. Five is the best on all three.
- Name the groups. 5-5-5 are champions. High frequency but low recency are customers slipping away. 1-1-1 are lost.
It works, and it is still worth doing. It has one big weakness.
Why fixed day counts get churn wrong
Recency scores treat every customer the same. Sixty days since the last order means one thing for a coffee brand whose customers reorder every two weeks, and something else entirely for a furniture store. Even inside one store, Yara who orders every 20 days and Adam who orders twice a year should not share a threshold.
The better signal is lateness against the customer's own cycle. Yara at day 40 is two cycles late and very likely drifting. Adam at day 150 is right on time.
Churn prediction from purchase cycles
A practical churn model for a commerce brand needs no machine learning team:
- For each repeat customer, compute their typical gap between orders.
- Compare today's gap since their last order with that typical gap.
- Label them: on time, cooling (one cycle late), at risk (about two cycles late), lapsed (well beyond that).
- Treat one-time buyers separately, using the store's typical time to second order.
This is how Nonito's Pulse groups customers into five bands: Just arrived, Growing, Regulars, Slipping and Lapsed. The Slipping band holds the cooling and at-risk customers, and it is usually where a win-back flow earns the most.
Turning the at-risk group into revenue
Prediction is only useful if something happens next. For the slipping group:
- Cooling customers get a light reminder on WhatsApp, in their language, with a link to what they usually buy.
- At-risk customers get the reminder, then a second touch with an offer inside your discount limit.
- Lapsed customers get one honest win-back attempt, and then you stop.
Start with the group worth the most per customer, not the largest one.
A worked example
Take four customers of a coffee subscription brand in Dubai on 1 October:
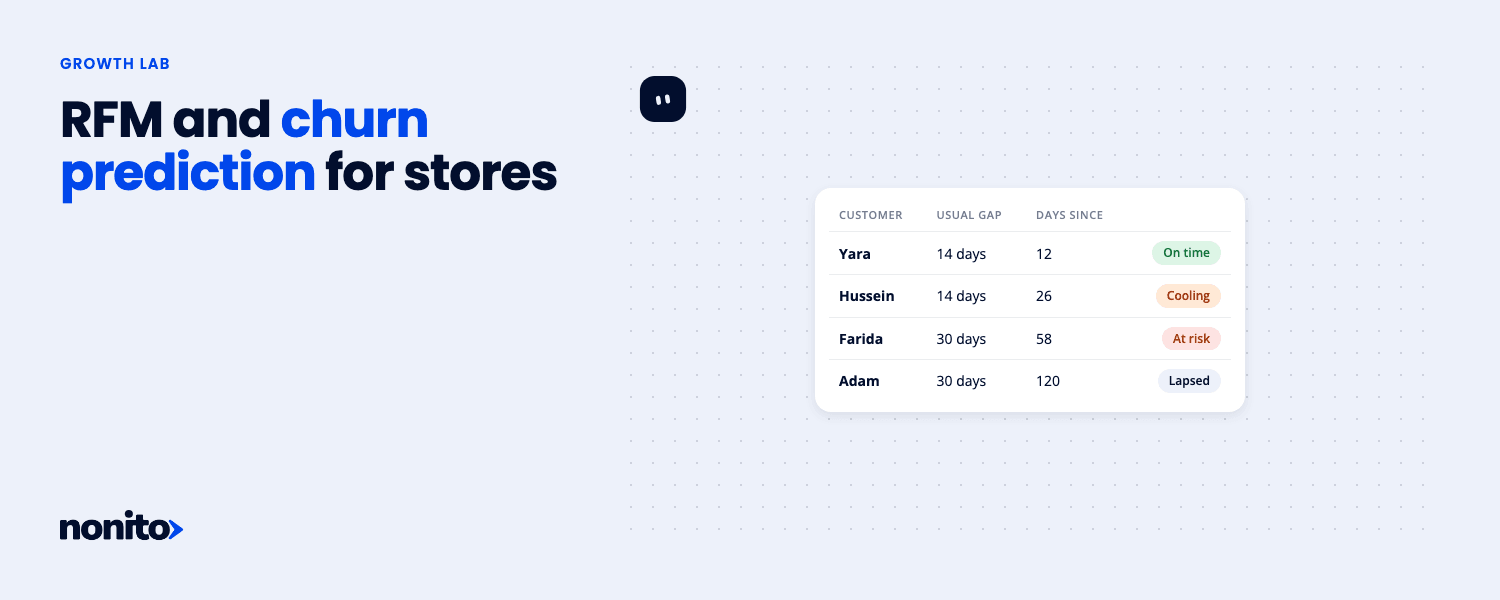
| Customer | Usual gap | Days since last order | Status |
|---|---|---|---|
| Yara | 14 days | 12 | On time |
| Hussein | 14 days | 26 | Cooling |
| Farida | 30 days | 58 | At risk |
| Adam | 30 days | 120 | Lapsed |
A fixed 60-day threshold would call all four "active" except Adam. It would miss Hussein and Farida entirely, and they are the two you can still save with a single message.
Mistakes to avoid
- Counting cancelled or refunded orders. They inflate frequency and value. Remove them first.
- Mixing one-time buyers with repeat buyers. A one-time buyer has no cycle yet. Use the store's typical time to second order instead.
- Running it once. Customers move between groups every week. A snapshot from last quarter tells you who was at risk then.
- Messaging the biggest group first. Start with the group that is worth the most per customer.
Doing this every week without a spreadsheet
The analysis above takes an afternoon the first time and goes stale the week after. Dome, Nonito's AI growth marketer, recomputes it every night from your store data, tells you how many customers moved into cooling and at risk this week, and builds the win-back flow for you to approve. Shopify stores connect directly. Salla and Zid stores connect through a custom integration over the Nonito API.
Read more about churn prediction with Dome, or see the eight lifecycle stages these groups map to.
Frequently asked questions
Is RFM still relevant?
Yes, as a starting point. Its weakness is that recency ignores how often each customer normally buys. Adding each customer's own cycle fixes most of that.
How many orders do I need for RFM to be useful?
Enough repeat customers to see patterns, usually a few hundred. With fewer, start by separating one-time buyers from repeat buyers.
Can I do this in Shopify without an app?
You can export orders and work in a spreadsheet. The hard part is repeating it every week, which is why most brands automate it.